The landscape of Indexed Universal Life (IUL) illustrations will be changing once again effective May 1, 2023. This is the latest in the Actuarial Guideline 49 (AG49) saga that dates back to 2015 when the first version was introduced.

AG49-A “version 2.0” will effectively put an end to using bonuses and multipliers that add additional accumulation value to an illustration (aside from the annual projected index credit). The result is another shift toward more conservative illustrations potentially impacting the way these products are sold.
This will be the third iteration of illustration changes the National Association of Insurance Commissioners (NAIC) has implemented under AG49. NAIC is the regulatory body that oversees fixed life insurance illustrations and sets standards for the industry.
Since IUL’s inception, the industry has struggled with what the appropriate way to show hypothetical returns on an illustration should be. As expected, interested parties were quick to voice their opinions on ways to approach this. And while the ultimate goal was to set reasonable expectations for the client, many of their opinions were biased by the type of product they were interested in selling.
Some parties were looking to align illustration expectations with whole life. Others thought being able to illustrate multipliers and bonus’ better demonstrated long term performance. In reality the regulation landed somewhere in the middle.
What's really changing?
At the core of every IUL is the budget, known as the hedge budget, the carrier uses to purchase index options for their policy holders. This budget is driven by the underlying performance of the general account assets of the insurance company. While other value outside of index credits can be provided to enhance a policy holder’s accumulation value inside the policy, they cannot be represented as part of the illustration with the new regulation.
The update to the regulation eliminates experience refunds, multipliers, and bonuses (guaranteed or not) from being shown in a hypothetical illustration, regardless of whether actual experience provides this added value. Not only are these added credits not allowed to be illustrated but no additional credits can be used to increase the hedge budget, i.e., additional charges, refunds, hedging efficiency credits, etc.
The result: the only additions going into the cash value of the illustration are index credits and index credits only.
Essentially every carrier now has to use their S&P annual point to point cap back casted 66 years to calculate their illustrated rate without any additional inflators built into the projections. This back cast will also have a limit per the regulation to discourage possible manipulation of the back cast calculation.
Liberties carriers have taken with current regulation.
While carriers may have technically followed the previous regulation, the NAIC feels they failed to follow the spirit of the regulation. AG49-A rolled out in December 2020 and caused carriers to shift where their budgets landed in the illustration calculation to show the best potential. More than likely this will shift their budgets back to the hedge budget, ironically getting carriers back to the base IUL structures that were in place before 2015 and the initial AG49.
While the industry expects illustration accumulation values to soften, many overlook the fact that distributions will be the area most impacted by certain carriers. AG49-A requires a policy with a participating or index loan to illustrate no more than 0.5% greater than their loan rate. For example, if a policy offers a 5% index loan charge rate, the illustration cannot show more than 5.5% on those loaned dollars.
Some IUL structures today illustrate higher than 0.5% over the loan rate once you include bonuses. Many carriers apply their bonus after the crediting rate, ultimately inflating the illustration return rate. But by inflating the illustrated rate they’re also inflating the loan.
While the loan regulation isn’t changing, distributions will likely see a greater proportional decline than the accumulation values by removing bonuses from the illustration.
Let’s say a carrier offered a 0.5% bonus to our previous example. The loan would charge 5%, the illustration would calculate a 5.5% credit, and the bonus would apply an additional 0.5% resulting in an index credit of 1% over the loan rate. Removing the bonus would bring the crediting back down to 0.5% over the loan rate. In this scenario, illustrated loans will be impacted substantially under the new regulation. Some carriers using bonuses could potentially see a 20% reduction in distributions assuming no internal changes to the product are made.
What is the core challenge with the regulation of IUL products?
Regulation tends to look at the current environment only without taking into account the fluctuations in index caps overtime. Each side of this argument brings statistics and back casting to support their viewpoint however many fail to look at actual performance.
I tracked the S&P performance going back 15 years (about the duration of the modern IUL product market resurgence) against actual index credit of a main player in the IUL space.
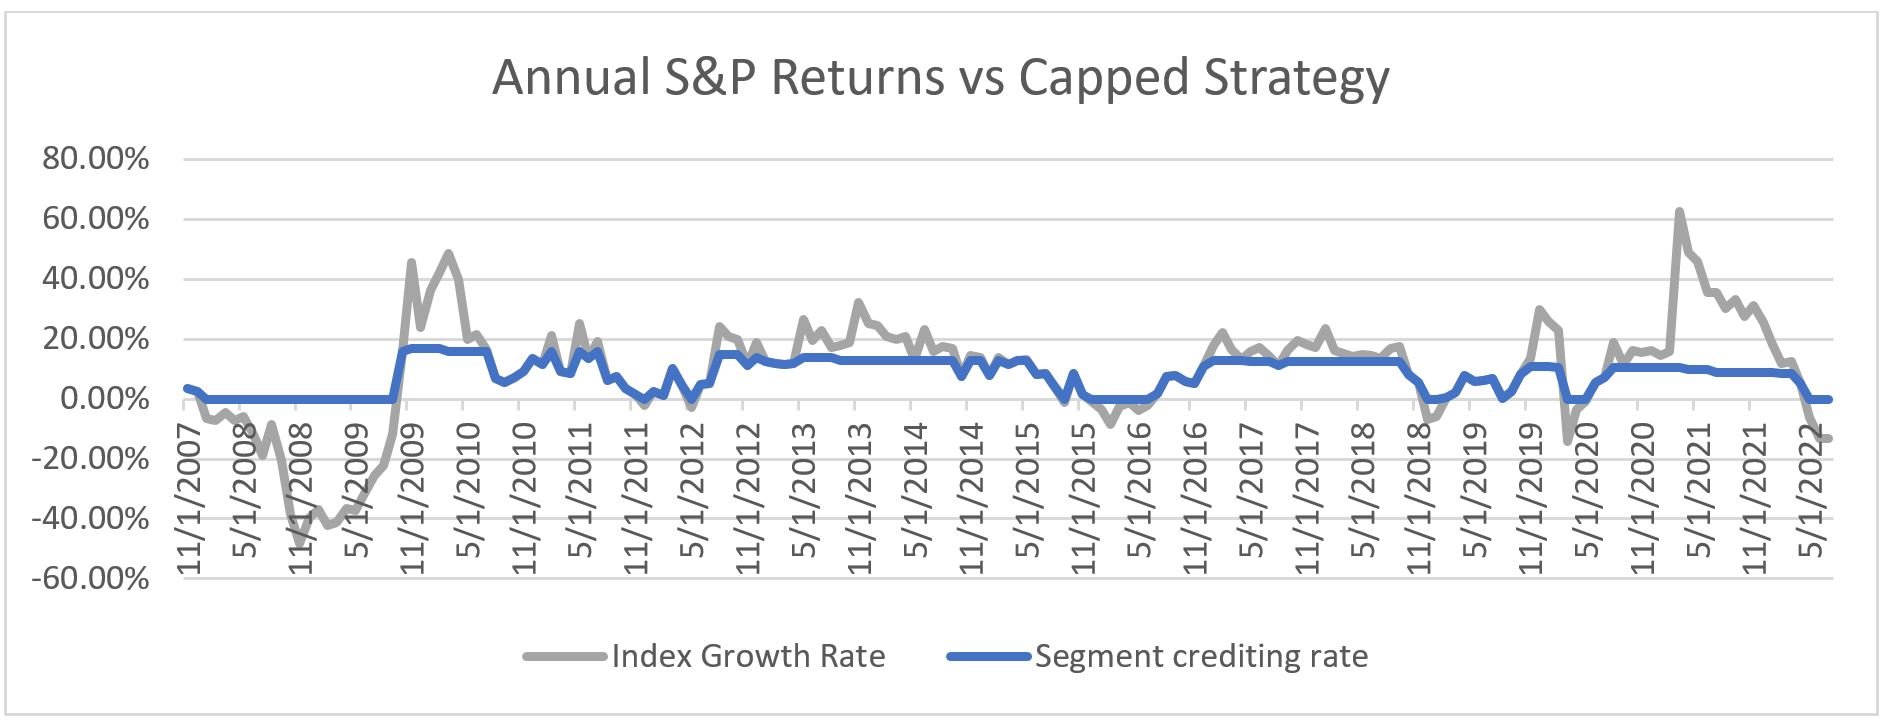
Over this 15-year period the IUL averaged 7.84% and yet current regulation is likely to limit illustrations to the 5.5% - 6.5% range. While caps have come down, the average index returns have been greater than every max illustrated rate regulation has proposed.
Regulation is essentially forcing the industry to under promise while products will likely over perform in the long run. IUL products have been able to perform well over the past 15 years despite constant downward pressure on caps due to low interest rates.
The rising interest rates over the past year will start to push caps up and we’ll likely see these moves start in 2023. While regulation will limit producers from illustrating the potential, clients likely will be bullish on IUL as their policies perform better than they expected.
Producers may want to use an illustration to demonstrate conservative performance with the thought that actual performance would likely be better. This would make for a pleasant surprise when the client receives their annual statement.
What is my opinion?
IUL illustrations have become very complex over the years as an attempt to represent a higher illustrated value with multipliers, buy up accounts, charge reductions, charge increases, and bonuses.
Ultimately this was the result of carriers trying to combat a decade of decreasing interest rates and reduction in caps while still attempting to illustrate the long-term potential of these products.
It’s no secret that the industry has struggled with “what’s reasonable” since the launch of AG49 in 2015. My advice, keep your IUL optimism. While past performance is not indicative of future results, I believe clients will be pleased with their IUL purchase long term if they have conservative expectations.
If you want to learn more about AG49-A, join us on Wednesday, March 29 @ 11:00 am Central for an AG49-A update from Allianz’s Austin Bichler, FSA, MAAA, AVP Actuary and Paul Huber, RICP, Regional Sales Director.